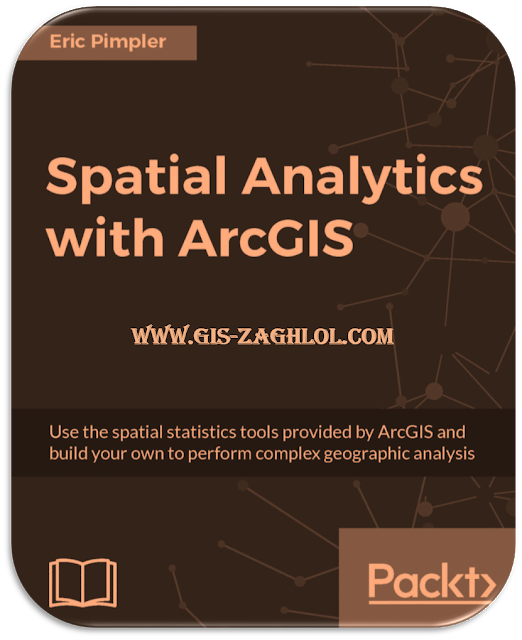
تحميل كتاب التحليلات المكانية في الارك Spatial Analytics With ArcGIS
تحميل كتاب التحليلات المكانية في الارك Spatial Analytics With ArcGIS ، استكمالا لسلسلة تعلم Learn GIS نقدم لكم في هذه المقالة كتاب التحليلات المكانية في الارك Spatial Analytics With ArcGIS ، من تأليف Eric Pimpler .
An Introduction to the contents of a book Spatial Analytics With ArcGIS
Introduction to Spatial Statistics
ArcGIS includes the Spatial Statistics Tools toolbox available for all license levels of its desktop software. Included with this toolbox are a number of toolsets that help analyze spatial distributions, patterns, clustering, and relationships in GIS datasets. This book will cover each of the toolsets provided with the Spatial Statistics Tools toolbox in ArcGIS to provide a comprehensive survey of the spatial statistics tools available to ArcGIS users.
The R platform for data analysis is a programming language and software platform for statistical computing and graphics, and it is supported by the R Foundation for Statistical Computing. The R language is widely used among statisticians and data analysts for developing statistical software and data analysis. In addition, R can be used for spatial statistical analysis and can also be integrated with ArcGIS through the R-ArcGIS Bridge.
Geographic Distributions with ArcGIS Tools
Obtaining basic spatial statistics about a dataset is often the first step in the analysis of geographic data. The Measuring Geographic Distributions toolset in the ArcGIS Spatial Statistics Tools toolbox contains a set of tools that provide descriptive geographic statistics including the Central Feature, Directional Distribution, Linear Directional Mean, Mean Center, Median Center, and Standard Distance. Together, this toolset provides a set of basic statistical exploration tools.
Modeling Spatial Relationships with ArcGIS Tools
In previous chapters, we examined tools that help us answer where questions. For example, where do burglaries cluster in a particular city? However, you may have noticed that they didn't address the logical progression of the problem such as why are the burglaries occurring in the first place? What are the factors that determine why burglaries are prevalent in a particular area? Answering these types of questions helps us model the relationships in our data. The Measuring Spatial Relationships toolset contains a number of regression analysis tools that help you examine and/or quantify the relationships amon features.
They help measure how features in a dataset relate to each other in space. In this chapter, you will learn how to use many of these tools to gain an understanding of a phenomenon, create predictive models of a phenomenon, and explore hypotheses.The following tools will be used to model the relationships between various spatial and attribute data:
- The basics of Regression Analysis.
- Using the Ordinary Least Squares too.
- Using the Exploratory Regression too .
- Using the Geographically Weighted Regression tool.
The basics of Regression Analysis
Up until this section of the course, we examined tools that help us answer the where questions. Where are crimes occurring? Where do wildfires cluster? Where are the hot spots for real estate sales? However, you may have noticed that these tools don't help determine the why questions.
The regression tools found in the Modeling Spatial Relationships toolset help with the logical progression of obtaining a deeper understanding of our problem. Tools such as Ordinary Least Squares and Exploratory Regression help us determine the variables that explain why an observed pattern is present. These explanatory variables can lead to the development of models that can predict the occurrence of these patterns in other places.
Why use Regression Analysis?
There are essentially three reasons to use Regression Analysis. The first is to gain an understanding of a phenomenon and effect policy or make decisions about appropriate actions to take. The next is to create predictive models of a phenomenon that can be applied to other areas, and finally, to explore hypotheses. Can you think of some examples that.
would apply to each of these?
Regression Analysis terms and concepts Before we examine the regression tools that are available to you, it's important to have an understanding of the terms that will be used in this section. In particular, you need to become familiar with the regression equation illustrated in the following screenshot.

